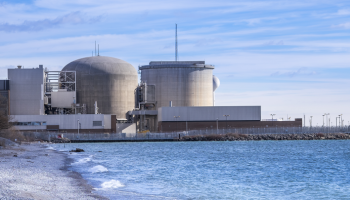
Uranium is a silvery-grey metal. After being mined and milled, uranium is processed to make fuel for nuclear power reactors to generate electricity. Canada is one of the world's largest producers of uranium.
This table contains natural resources satellite account data described by the following dimensions (Not all combinations are available): Geography; Prices (2 items: Current prices; 2017 constant prices); Sectors; Sub-sectors; Indicators; Commodities.
The average age of investment is the weighted age of all investments remaining in the gross stock at year end. The remaining useful life, which is the difference between the average age of the investment spending and their expected service life, is then divided by the expected service life, creating a ratio that indicates the percentage of the asset class that remains.
The economic contribution as a result of the production of infrastructure assets due to investment is presented for valued added (GDP), compensation of employees and number of jobs. Value-added is a key measure of economic performance. It represents the output of an industry minus the value of intermediate inputs that were used up in the production of the goods and services. Within the Infrastructure Economic Accounts, this is the value added due to an industry's production of infrastructure assets. The number of jobs represents the number of jobs held by the self-employed, employees and unpaid family workers. The compensation of employees represents the wages and salaries, and supplementary labour income due to labour inputs for the production of infrastructure assets.
Expansion of the Infrastructure Economic Accounts focusing on the environmental aspect to aid in understanding the relationship between investment in infrastructure and the environment. Main indicators include greenhouse gas emissions as a result of production of infrastructure assets, greenhouse gas emissions per value-added, and clean input proportion.
Infrastructure is the physical structures and systems that support the production of goods and services and their delivery to and consumption by governments, businesses and citizens. The industry undertaking that infrastructure investment is also presented. Accumulating investment flows over time produces an estimate of the stock of infrastructure assets. The perpetual inventory method is used as it estimates a value of the net stock of fixed assets in existence and in the hands of producers which is generally based on estimating how many of the fixed assets installed, as a result of investment undertaken in previous years, have survived to the current period. The depreciation of that stock is calculated using the geometric method with asset specific depreciation profiles.
Electricity generation by class of electricity producer (electric utilities, electricity producers, industries, etc.) and type of electricity generation (hydroelectric, combustible fuels, wind, etc.). Data are presented at the national and provincial levels, however not all combinations are available.
February 11, 2025 - Independent Electricity System Operator
Energy output and capability for generating facilities in the IESO-administered energy market with a maximum output capability of 20 MW or more. For variable generation only, forecast values are published instead of capability. Report range - 90 days.
Destiné tant aux acteurs du milieu qu’à la population, ce bilan annuel rassemble les données les plus récentes et les plus pertinentes sur le secteur de l’énergie. Il propose une rétrospective des faits saillants qui ont marqué la dernière année ainsi qu’un aperçu des dossiers à surveiller pour l’année à venir.
Canada’s electricity supply generation mix varies significantly among Canada’s provinces and territories. Canada’s future Energy Supply and Demand Projections are reported by the Canada Energy Regulator.
Renewable energy is energy derived from natural processes that are replenished at a rate that is equal to or faster than the rate at which they are consumed. There are various forms of renewable energy, deriving directly or indirectly from the sun, or from heat generated deep within the earth.
This reference guide is intended for users of the Survey of Environmental Goods and Services (SEGS). The tables indicate which technologies and services were included in SEGS.
The Energy Fact Book provides key information on energy markets in Canada in a format that is easy to consult, providing solid foundation for Canadians to understand and discuss important developments across the energy sector.
This report states the energy production of each province including: Crude Oil, Refined Petroleum Products (RPPs), Natural Gas/Natural Gas Liquids (NGLs), Electricity, Trades, Energy Consumption and Greenhouse Gas (GHG) Emissions and more.
To select a specific category or sub-category, select the desired toggle elements within the tool box on the left hand side (i.e., Industry or Reference period). Depending on the data views selected, multiple choices may be available for subject categories, geographies, reference periods, etc. To view the associated data, select the "Data table" tab located on the top right hand corner of the data visualisation.
To return back to the visualisation, select "Map" or "Chart" tab which is next to the Data table tab.
To access other available options, such as to export or sort, position your mouse over the top right hand corner of the data visualisation then select the three consecutive points [...] that will appear. From there you can then select the desired option that follows (Export data, Show as a table, Spotlight).
To access the various referenced data tables used to prepare the visualisation, select "Data sources" located directly below it then click on the applicable table.