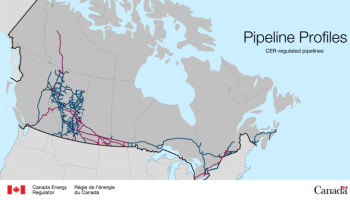
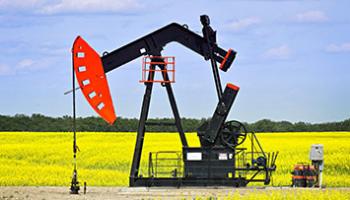
Crude oil—also known as petroleum—is an energy-rich liquid consisting mainly of hydrocarbons. In Canada, Alberta's oil sands contain the largest reserves of crude oil, but there are also large deposits off the coast of Atlantic Canada. Crude oil activities include exploration, drilling, production, field processing, and the storage and transportation of oil.
Crude oil and petroleum products opening and closing inventories, by mode of transport including pipelines, marine vessels and associated terminals, by product type, monthly, not seasonally adjusted.
Crude oil and petroleum products movements, by mode of transport including pipelines, marine vessels and associated terminals, by product type, moved from shipping region to receiving region, monthly, not seasonally adjusted.
Monthly primary and secondary energy by fuel type in terajoules (coal, natural gas, electricity, etc.) and supply and demand characteristics (production, exports, imports, etc.) for Canada.
Data presented on petroleum and other liquids by supply and disposition characteristics (e.g., production, exports, inventories, products supplied). Not all combinations are available.
Supply and disposition characteristics such as production (fuels include heavy crude, synthetic crude, etc.), input to refineries, exports and others. The data are available at the national and provincial levels. Not all combinations necessarily have data for all years.
Gross Domestic Product (GDP) at basic prices, by North American Industry Classification System (NAICS) aggregates, by Industry, volume measures, monthly, 5 most recent time periods.
This table contains natural resources satellite account data described by the following dimensions (Not all combinations are available): Geography; Prices (2 items: Current prices; 2017 constant prices); Sectors; Sub-sectors; Indicators; Commodities.
March 21, 2025 - Environment and Climate Change Canada
This contains the data for Canada's official national greenhouse gas inventory. Canada's official national greenhouse gas inventory is prepared and submitted annually to the United Nations Framework Convention on Climate Change (UNFCCC) by April 15 of each year, in accordance with the Guidelines. The annual inventory submission consists of the National Inventory Report (NIR) and the Common Reporting Format (CRF) tables. Gases for which emissions are estimated include carbon dioxide (CO2), methane (CH4), nitrous oxide (N2O), hydrofluorocarbons (HFC), perfluorocarbons (PFC), sulfur hexafluoride (SF6) and nitrogen trifluoride (NF3). The report covers: anthropogenic (human-caused) emissions by sources and removals by sinks and annual emissions estimates dating back to 1990.
These papers provide background information as well as in depth analysis on data reported in any of the following accounts: income and expenditure accounts, provincial economic accounts, financial flow accounts, national balance sheet accounts, estimates of labour income, and national tourism indicators.
March 21, 2025 - Environment and Climate Change Canada
All editions of the complete report of Canada's official national greenhouse gas inventory. Gases for which emissions are estimated include carbon dioxide (CO2), methane (CH4), nitrous oxide (N2O), hydrofluorocarbons (HFC), perfluorocarbons (PFC), sulfur hexafluoride (SF6) and nitrogen trifluoride (NF3). The report covers anthropogenic (human-caused) emissions by sources and removals by sinks and annual emissions estimates dating back to 1990.
March 21, 2025 - Environment and Climate Change Canada
The complete report of Canada's official national greenhouse gas inventory, 2025. Gases for which emissions are estimated include carbon dioxide (CO2), methane (CH4), nitrous oxide (N2O), hydrofluorocarbons (HFC), perfluorocarbons (PFC), sulfur hexafluoride (SF6) and nitrogen trifluoride (NF3). The report covers anthropogenic (human-caused) emissions by sources and removals by sinks and annual emissions estimates dating back to 1990.
March 21, 2025 - Environment and Climate Change Canada
The executive summary of Canada's official national greenhouse gas inventory, 2025. Gases for which emissions are estimated include carbon dioxide (CO2), methane (CH4), nitrous oxide (N2O), hydrofluorocarbons (HFC), perfluorocarbons (PFC), sulfur hexafluoride (SF6) and nitrogen trifluoride (NF3). The report covers anthropogenic (human-caused) emissions by sources and removals by sinks and annual emissions estimates dating back to 1990.
Destiné tant aux acteurs du milieu qu’à la population, ce bilan annuel rassemble les données les plus récentes et les plus pertinentes sur le secteur de l’énergie. Il propose une rétrospective des faits saillants qui ont marqué la dernière année ainsi qu’un aperçu des dossiers à surveiller pour l’année à venir.
Pipeline Profiles allow users to easily locate information about CER-regulated pipelines to gain meaningful insights. Discover where pipelines are located, what products (and how much) they transport. Learn about recent facility projects and where to find regulatory filings. Examine pipeline tolls and tariffs, abandonment, and financial information. Explore safety and environment information through interactive dashboards. Find links to pipeline companies’ emergency management plans.
This report shows trends in Canada's energy use, energy intensity, energy efficiency and greenhouse gas emissions between 2000 and 2020. It also shows trends in Canada's energy use within the residential sector, commercial and institutional sector, industrial sector, and transportation sector.
To select a specific category or sub-category, select the desired toggle elements within the tool box on the left hand side (i.e., Industry or Reference period). Depending on the data views selected, multiple choices may be available for subject categories, geographies, reference periods, etc. To view the associated data, select the "Data table" tab located on the top right hand corner of the data visualisation.
To return back to the visualisation, select "Map" or "Chart" tab which is next to the Data table tab.
To access other available options, such as to export or sort, position your mouse over the top right hand corner of the data visualisation then select the three consecutive points [...] that will appear. From there you can then select the desired option that follows (Export data, Show as a table, Spotlight).
To access the various referenced data tables used to prepare the visualisation, select "Data sources" located directly below it then click on the applicable table.